To track my crypto protfolio I searched some Websites and Apps but was not quite satified with all of them, so I questioned myself if it’s possible to make my own tracker with some Google Sheets scripting and the public Coingecko API. Here is how I did it and how you can use it too.
Let’s first have a look of what I implemented so far, after that I’ll explain how I did all of this.
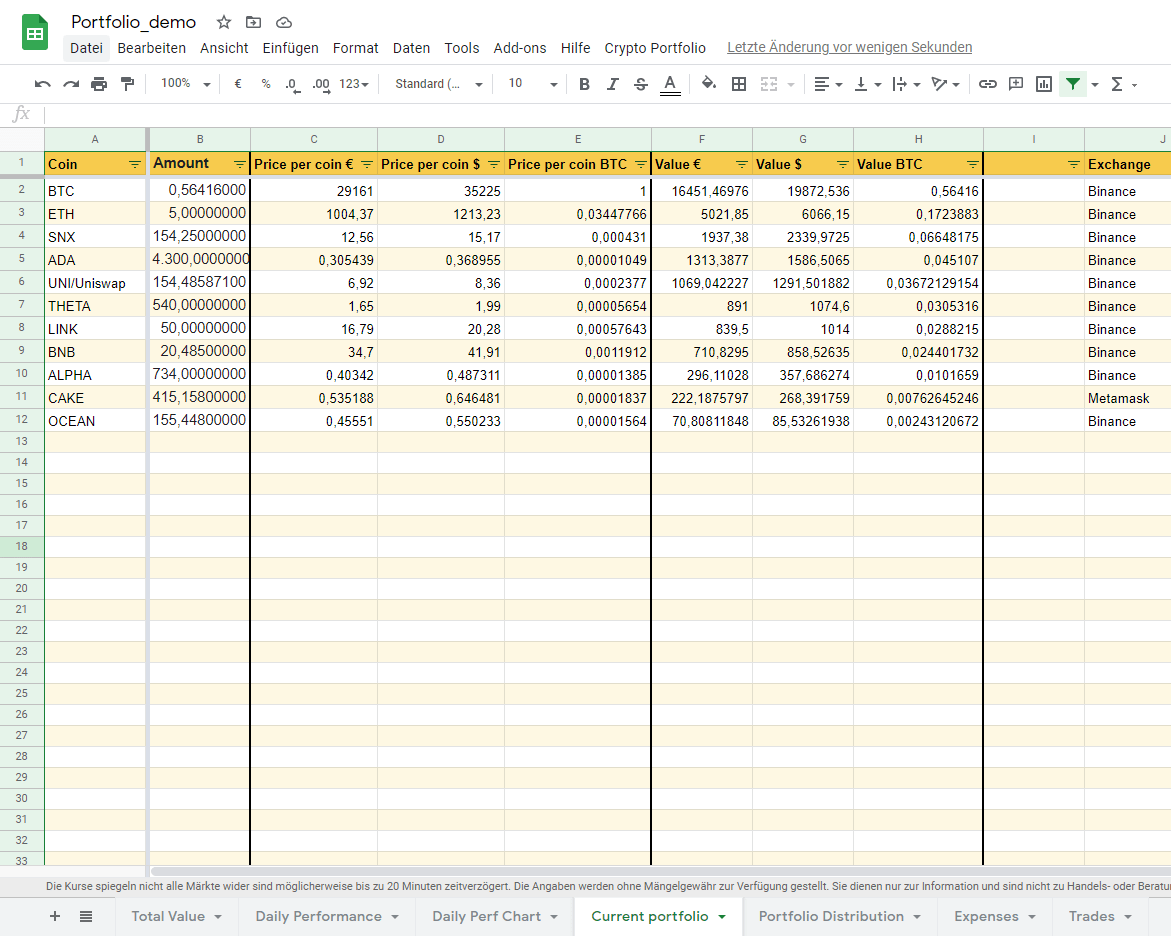
It works by putting in the coins ticker and the amount you have. With the list of coin tickers it calls the Coingecko API and from there it gets the price per coin in Euro, Dollar and BTC and then some simple multiplication. The prices are updated everytime you are opening the sheet or optionally there is also a new UI element on top where you can get the current prices manually.
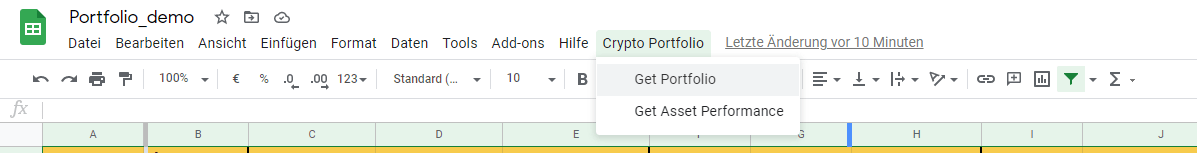
This below is are the menu elements you could click. The first one “Get Portfolio” updates the current prices of each coin listed in the “Current portfolio” sheet. This is also automatically done when opening the sheet and when updating the total value each hour. The second item “Get Asset Performance” is exactly doing first what the “Get Portfolio” does, so it updates the current prices, then it gets the total sum and adds them into an hourly list where you can find the performance of your portfolio. (see below)
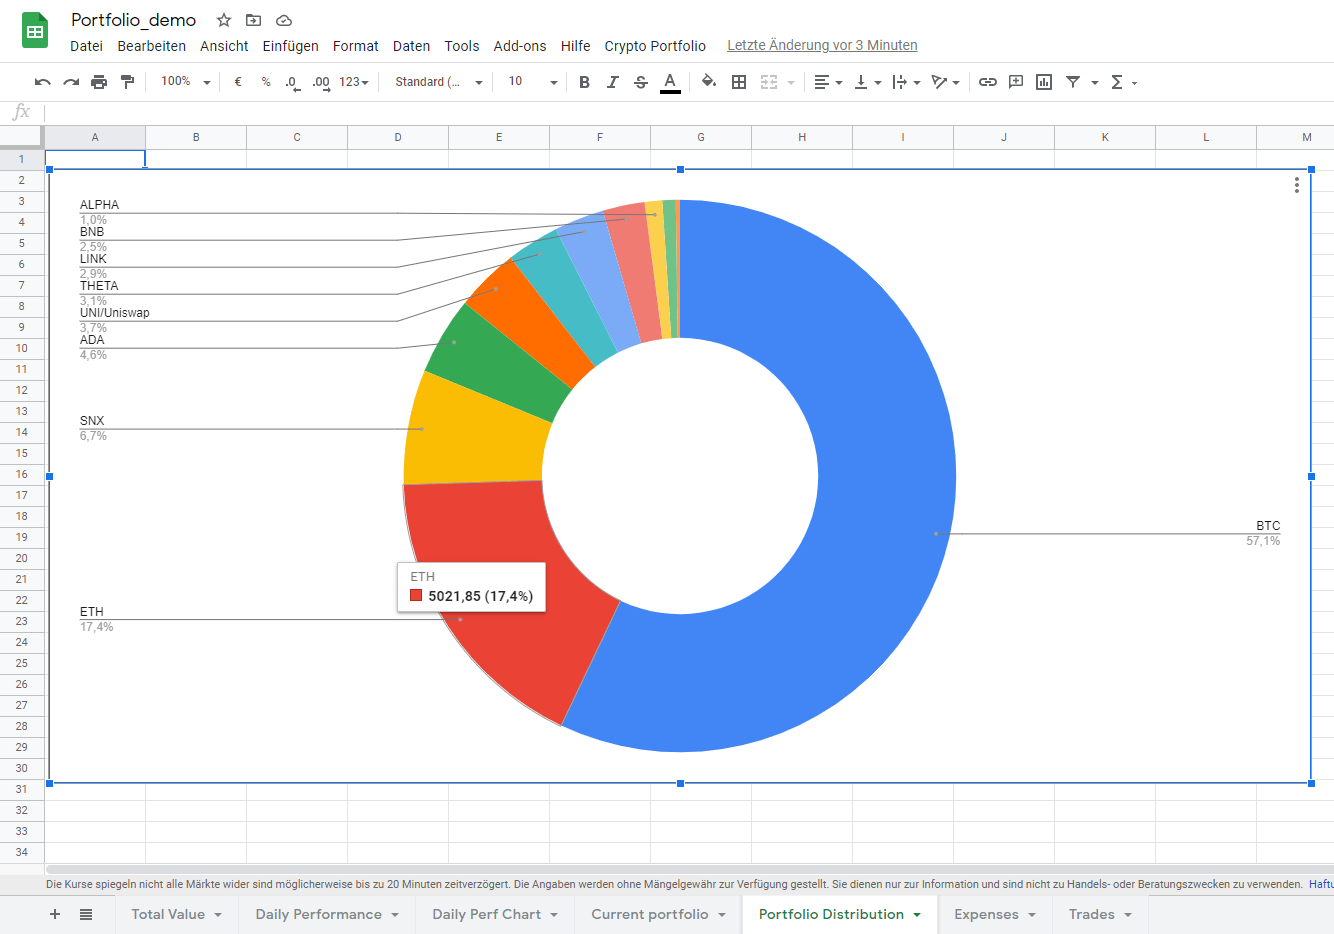
Also there is an overview of how your portfolio is distributed.
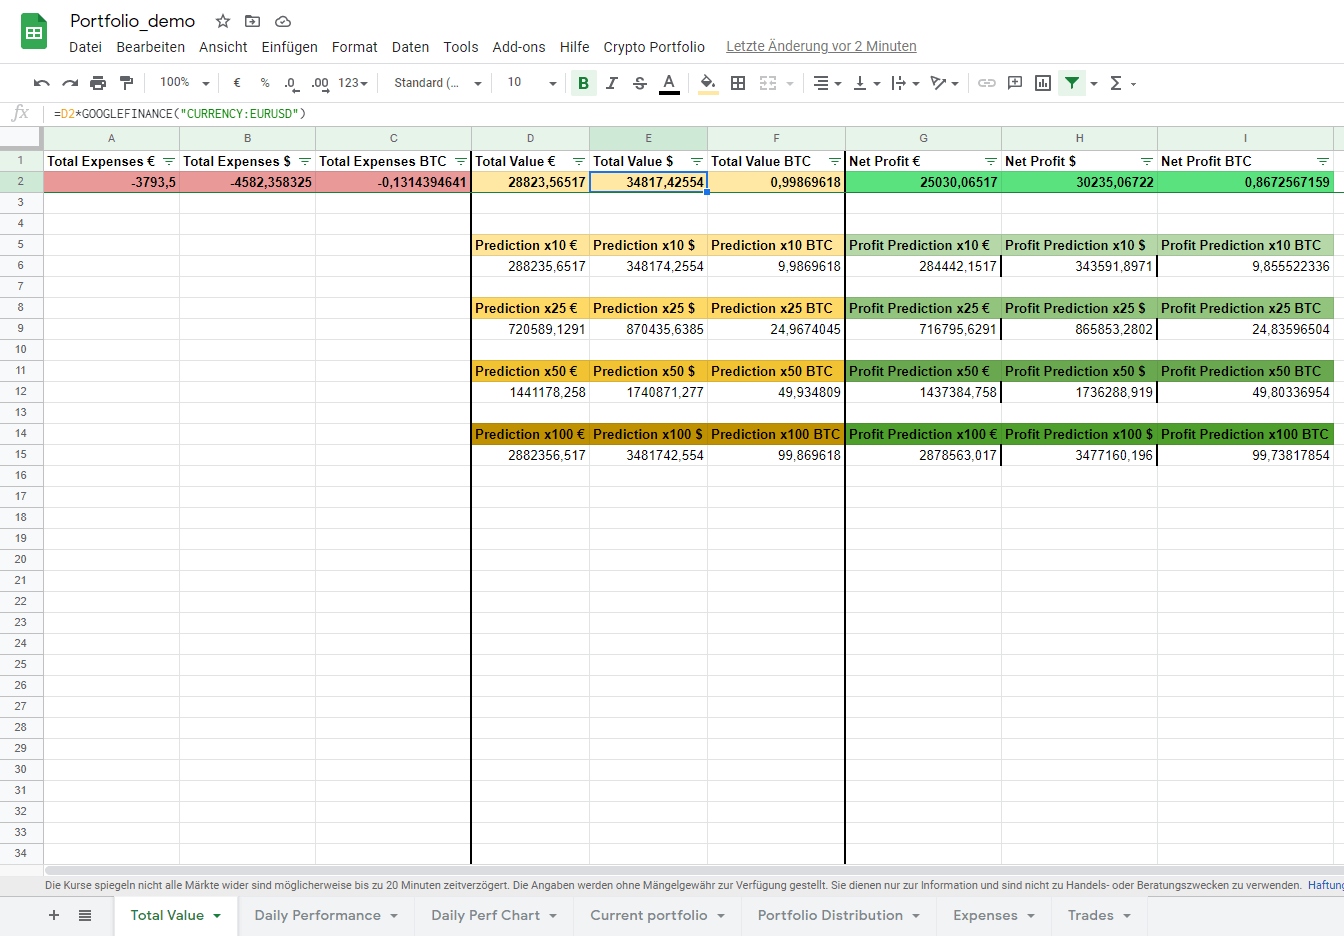
On another sheet all of it is summed up and you also can give how much your expenses were. So with that one can display what the net profit currently is. Also I added some simple (dream) predictions what if the current portfolio increases time 10, 25, 50 or 100 ¯\_(ツ)_/¯
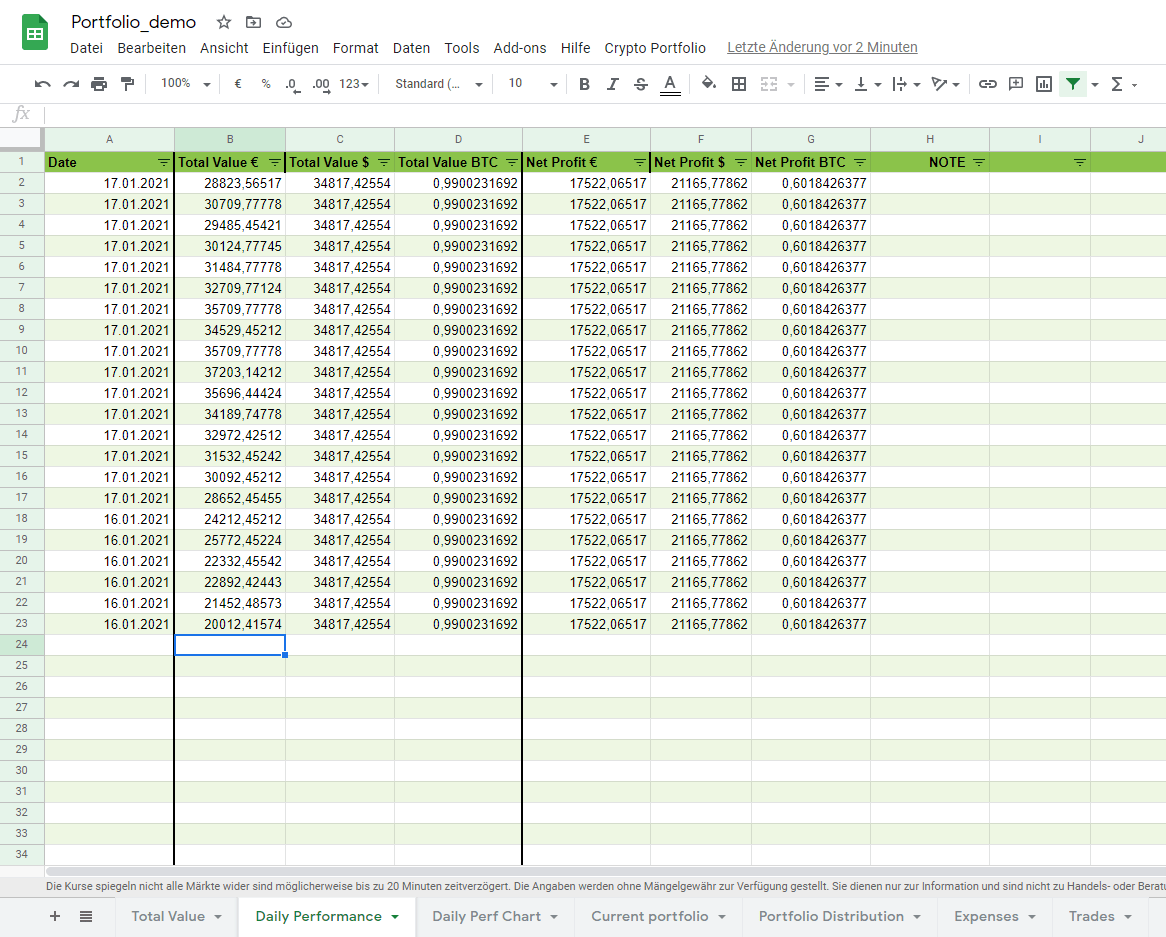
After that I also wanted to track my performance, for that I used another small script which updates the current prices every hour and stores the current overall portfolio value and net profit in a separate sheet which is also displayed in a line graph. The hourly trigger is a feature that is included in the google sheets scripting. Note that the numbers here are just made up and for this demo I just manipulated the Euro values to have some variance for the graph later.

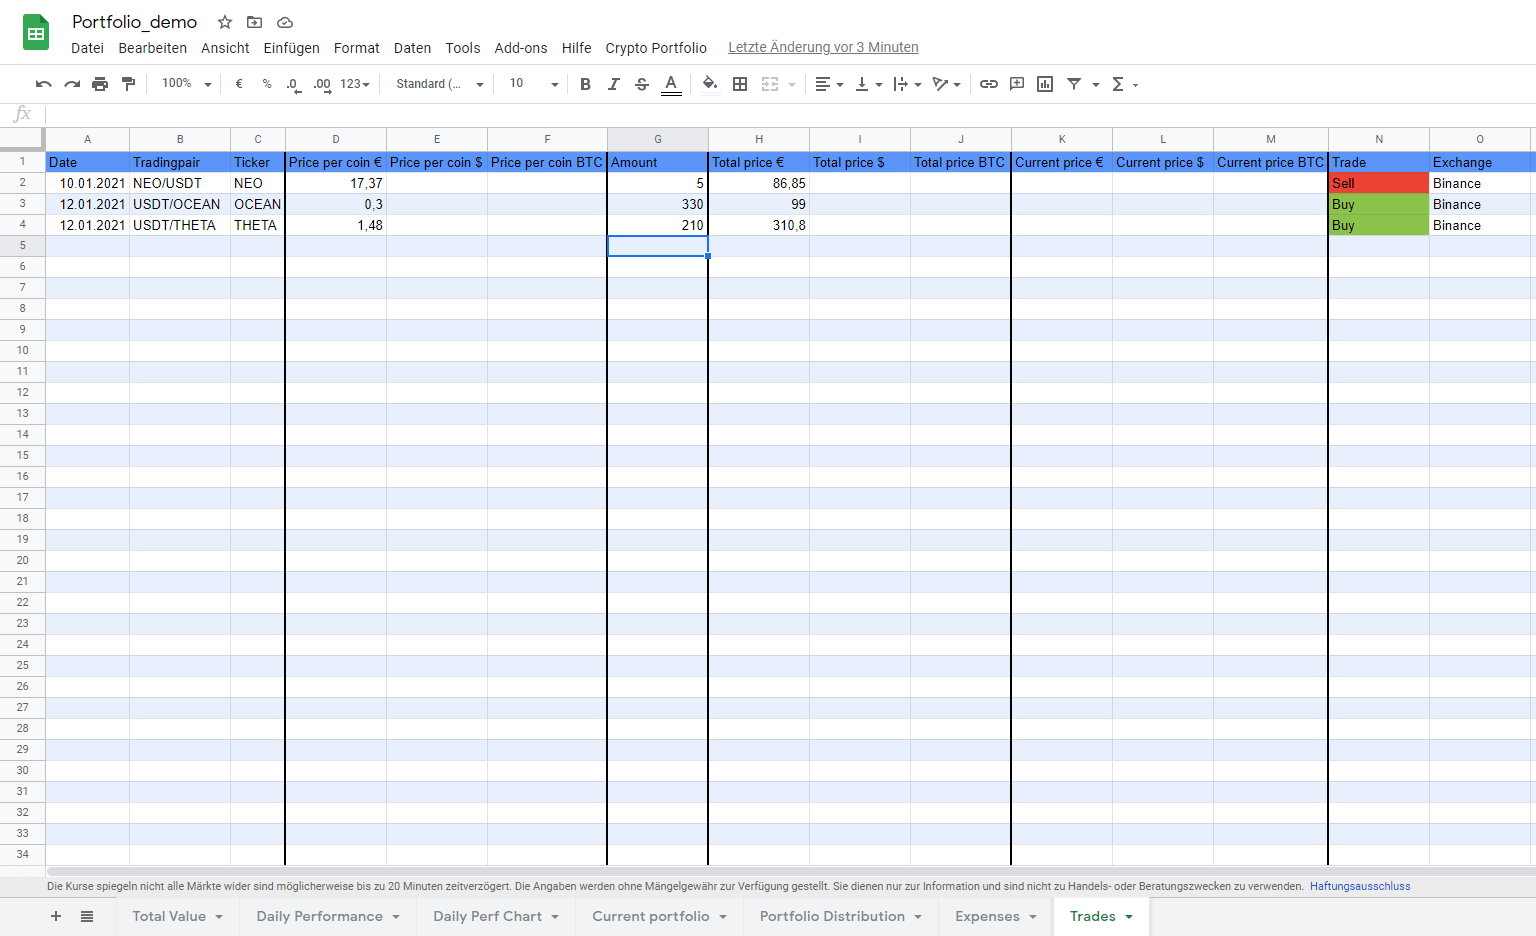
Last page is to track your trades basically, but for now this is not doing much but in the future I want to show somehow how your purchase performed percentage wise or something.
Part 2 how you can do this too is coming in a few days!